2024-03-21
Human participants listened to 12 audio recordings of baby cries that varied in intensity. Participants heard each cry and rated how distressed the infant was in each cry. After hearing all cries, participants reported how much the cries upset them. Additionally, participants completed a self-esteem measure (10-item Rosenberg).
outcome:
- crytotl (how distressed were the infants)
IV/explanatory variables:
- esteem (self esteem)
- upset (how much did the cries upset you?)
Affect is more positively related to judgments of the babies' distress in high, compared to low, self-esteem individuals. (esteem moderates the relation of upset to crytotl)
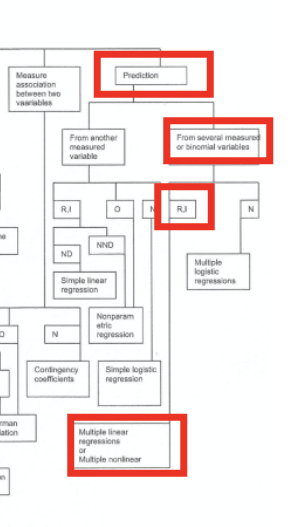
Multiple linear regression.
crytotal - pretty much normal, one low valueupset - pretty much normalesteem - left skew (ceiling, restricted range?)crytotl ~ upset_cent + esteem_cent + upsXestnull hypotheses (full model test) - the specified model describes the data no better than the null model (mean only)
R-squared tells us the full model explains .388 of the variance in distress ratings
F-stat tells us that the model fit to the data is unlikely (p<.001 if there is model is not better than the null)
coefficient for the interaction is .223, p = .01, telling us it is unlikely we would observe a coefficient at least as large if there is no true interaction effect.
One approach to visualize an interaction between two continuous variables is to choose low, medium, and high values of the moderator, and plot the predicted association between predictor and outcome at each of those levels (see the "moderation and mediation" activity in R):
process y=crytotl /x=upset /w=esteem /plot=1 /model=1.The full regression model included distress judgment of baby cries (mean across all cries) as the outcome, with explanatory variables of negative affect, self-esteem and the interaction of both. The full model fit the data better than the null model (F(3,43) = 9.092, p < .0001, R2 = .388). The interaction term was significant (beta = 0.223 std. error = 0.083, t(43) = 2.693, p = .01).